F-Distribution Function app for iPhone and iPad
Developer: Donald Schaefer
First release : 10 Sep 2014
App size: 536 Kb
In probability theory and statistics, the F-distribution is a continuous probability distribution.
The F-Distribution Function Calculator calculates the F-Distribution Cumulative Probability associated with a f value and two Degrees of Freedom.
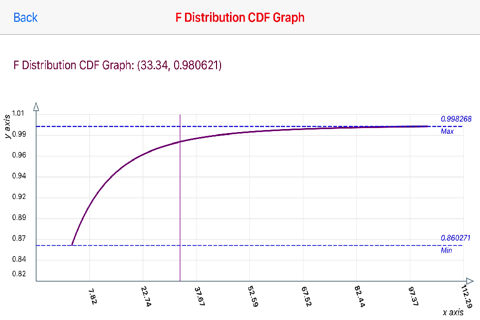
The F-Distribution Function Calculator also displays a graph for the generated F(x) values from the x random variable and the df(1) and df(2) Degrees of Freedom input variables and displays a table of the graphed values.
The graphs are touch enabled graph. Upon touching the graph a vertical line appears. Move the vertical line to the left or right to display the point x/B(x,y)
The horizontal x-axis displays x values. The vertical y-axis plots a range of either the x-increment and y-increment values
Horizontal Max and Min dashed lines display the Maximum and Minimum values.


